The NPD Group looks at the biggest growth drivers of 2016, and touches on what the new year will bring.
by Juli Lennett, U.S. Toys Industry Analyst, The NPD Group
Crossing the $20 billion threshold, the U.S. toy industry grew 5 percent to $20.4 billion in 2016, according to retail sales data* from global information company The NPD Group. Unit sales also grew 5 percent to $2 billion, and average retail price remained flat at $10.14. The industry was 16 percent larger in 2016 than 2013, which calculates to a compounded annual growth rate of 5 percent.
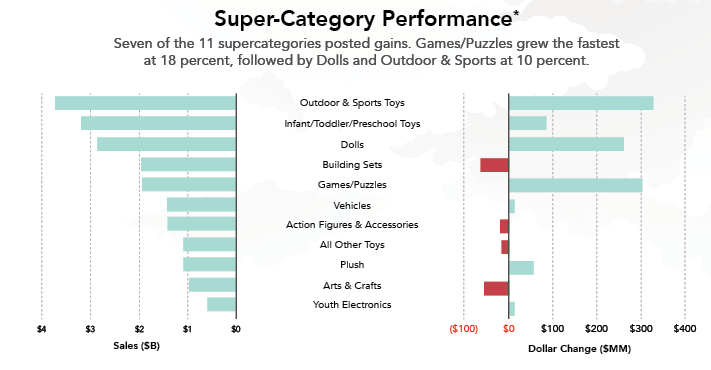
In terms of sales performance across the supercategories tracked by NPD, seven of the 11 supercategories posted gains in 2016. Games/Puzzles grew the fastest at 18 percent, followed by Dolls and Outdoor & Sports Toys, both at 10 percent. The only other supercategory to outperform the total market—which may come as a surprise to some—is Plush. This supercategory grew 6 percent, as it had a number of new and strong introductions in 2016 that brought excitement to the supercategory, as well as a revival of Pokémon plush, which coincided with the Pokémon Go phenomenon and Pokémon Moon and Pokémon Sun video games. Properties that drove the gains for the fastest growing supercategories were:
Games/Puzzles: Pokémon, Pie Face, Speak Out
Dolls: Shopkins, Trolls, Baby Alive
Outdoor & Sports Toys: Nerf, Bunch O Balloons, SwagTron
Plush: Five Nights at Freddy’s, Pokémon, Little Live Pets
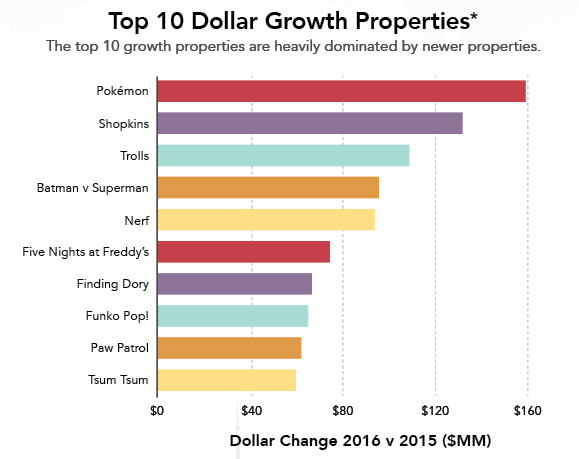
Looking at the top-growing properties based on dollars, the 2016 list is heavily dominated by newer properties, contrary to 2015, which represented a balance of new with decades-old properties. This should be encouraging news to toymakers as it illustrates that their innovation and creativity is resonating with consumers. Another interesting observation made from this list is that three of the 10 have movie tie-ins from films released in 2016: Trolls, Batman v Superman: Dawn of Justice, and Finding Dory. Also, six of the top-growing properties have a strong collectible aspect, and as we saw last year, collectibles and blind packs were a growth driver for the toy industry.
It’s difficult to narrow down the industry’s biggest growth drivers in 2016, but one of the highlights of success was definitely the collectibles** market, which grew 33 percent to reach $1.8 billion in sales. There were a lot of new collectibles choices last year, and, as I predicted heading into the holiday season, blind packs especially would make great stocking stuffers for Christmas. Indeed, blind packs grew 60 percent in the last year. Since 2013, blind packs have grown more than six-fold.
Outdoor & Sports Toys, the largest supercategory with dollar sales representing about a quarter of all toy industry sales, was also a growth driver in 2016. It experienced the largest dollar gains of any supercategory, at $328 million, and leading the growth were sports toys and summer seasonal. The trend toward healthier living and millennials seeking a more active, outdoor lifestyle for their kids likely drove the growth of these categories.
The Games segment was also important to the toy industry’s success in 2016, and the trend happening here is definitely one to watch. Games grew $307 million, or 21 percent, in 2016, with games for kids through adults all showing growth, from family strategy games to brain teasers. Hasbro’s Pie Face Showdown and Speak Out both landed in the top-10 list (see page 64) of new items for 2016. This trend will likely continue to flourish as families look for more fun together.
Star Wars was another success story for the toy industry in 2016. While there were some who did not believe it would match its dollar sales from 2015, Star Wars not only matched but outperformed in 2016, with nearly $760 million in sales. While this does not account for much growth in the entire scheme of things, it is worth noting because had it gone in the other direction, it could have had a significant impact on the year.
Retail sales over the 2016 holiday shopping season were mixed, and while the fourth quarter grew 3 percent compared to 2015, a few key factors were at play to cause the first three weeks of December to see softer sales. Early Cyber Monday online promotions helped grow toy sales during Black Friday week by 6 percent, but at the expense of Cyber Monday week and potentially tainting the remainder of the season. The tremendous online growth likely deterred the impulse purchase behavior that occurs when consumers shop in a physical store, especially if they have children in tow, and was likely a factor in slowing overall holiday growth. In addition, especially with Christmas falling on a weekend, consumers waited until the last minute to shop, growing the shopping week before Christmas by 28 percent, but likely at the expense of total shopping visits and overall holiday spend.
In our Holiday Shopping Bag 2016 reports spanning the latter nine weeks of the holiday season, NPD tracked the weekly performance of a number of key categories, including toys, apparel, technology, athletic footwear, and prestige fragrance. Aggregating these industries over the nine-week period, overall sales were down 1 percent compared to 2015. During this time, the toy industry grew by 3 percent, performing four points better than the collective whole.
The U.S. toy industry is on a growth trajectory, but this does not mean it is time to relax. We are at a pivotal point to look forward and consider what is next, so the industry may continue breeding success and innovation, and we can continue on this fantastic path to more growth.
 Juli Lennett, senior vice president, industry analyst for The NPD Group’s U.S. Toys division, has spent the past 11 years at NPD managing client relationships and consulting to a variety of manufacturers, licensors, and retailers within the toy industry.
*Source: The NPD Group Inc. / Retail Tracking Service, January-December 2016
Data is representative of retailers that participate in The NPD Group’s Retail Tracking Service. NPD’s current estimate is that the Retail Tracking Service represents approximately 80 percent of the U.S. retail market for toys. Projected to 100 percent of the market, the U.S. toy industry is estimated at about $26 billion.
**Collectibles include Non-Strategic Trade Cards/Collectible Stickers, Strategic Trading Card Games, Mini Figures & Scene Sets, Action Figure Collectibles & Accessories, Playset Dolls & Collectibles, Blind Packs, as well as assorted brands that are collectible.
This article was originally published in the February 2017 issue of The Toy Book.


