

by Juli Lennett, vice president, industry advisor, U.S. toys, The NPD Group
U.S. toy industry retail sales grew 16% in 2020, generating $25.1 billion, for an increase of $3.5 billion year over year. The U.S. toy industry exceeded $32.6 billion in annual sales for the first time in history, when projected to 100% of the total market. This record-breaking growth occurred despite the fact that unit sales for the year were flat at $2.1 billion. The average selling price in 2020 increased by 16%*.
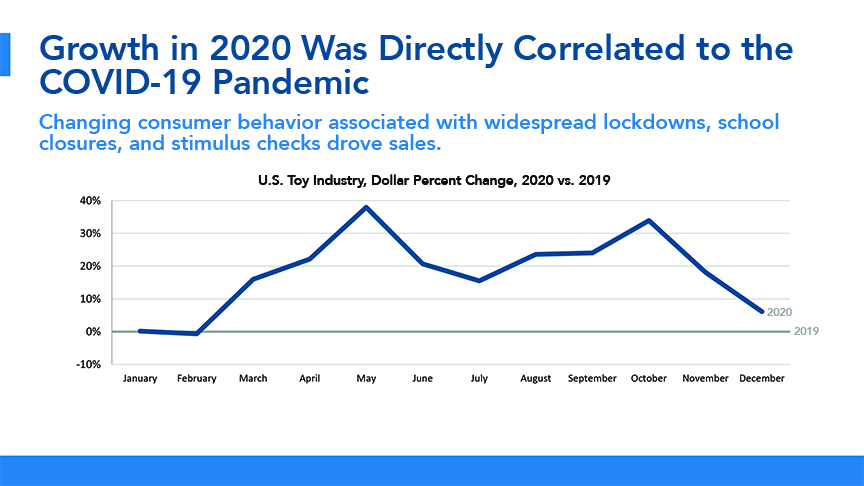
Much of the growth in 2020 was directly correlated to the COVID-19 pandemic and the changing consumer behavior associated with widespread lockdowns and school closures, the disposable income diverted from other types of entertainment to toys, as well as the onset of federal stimulus checks. While toy sales through mid-March 2020 were flat versus 2019, widespread lockdown measures led to an abrupt increase in sales. This was further amplified by the distribution of stimulus checks beginning in April, resulting in the strongest month of growth for the year in May (+38%). Toy industry growth peaked again in October with an increase of 34% when the holiday season kicked off with Amazon Prime Day along with other retailer deals the same week.
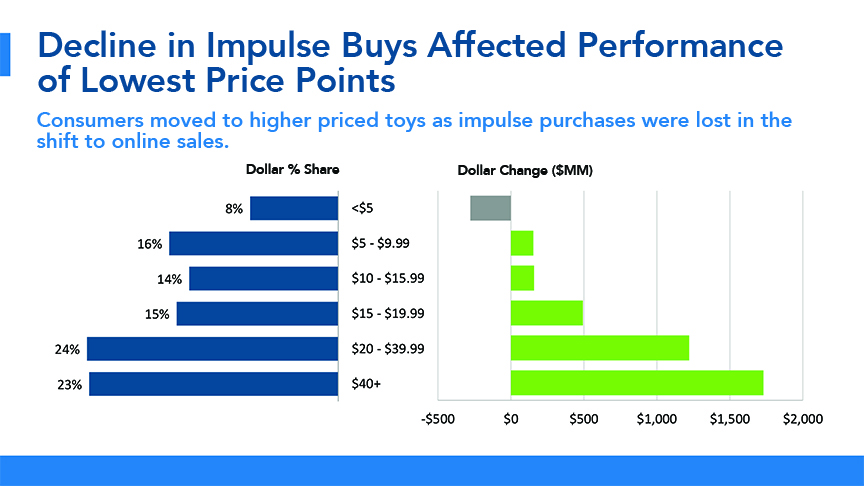
Another key consideration is that many of the classes that experienced the strongest dollar growth (i.e. standard building sets, skates/skateboards/scooters, playground equipment, and ride-ons) include a large percentage of items that are in the $20 and above price segments. Collectively, these higher-priced segments were responsible for almost 80% of the gaining price segments. By contrast, price points below $5 were the only price segment that declined in 2020. This decline is directly correlated to a steep decline in impulse purchasing. Put simply, the pandemic impacted performance by price segment in a couple of big ways.
First, families bought higher-priced items to keep their kids busy; and second, because of much higher online sales, there were fewer consumers shopping in stores — where most impulse buys occur. From our consumer data, we know that for the year-to-date September period, impulse buys were 32% of brick and-mortar sales and only 18% of online sales. While units declined in seven of the 11 supercategories, average selling price increased in every supercategory. The increase in average price was a key driver of the growth in dollar sales and was driven by a shift in product mix to higher-priced categories.
As mentioned above, another major theme in 2020 was the growth of online shopping. Retail closures and consumer hesitancy toward shopping in stores led to a surge in online toy sales. In the first three quarters of 2020, the online channel gained 10 share points from the 23% share in 2019, leading to 75% growth in overall online toy sales year over year**. Not only did online toy retailers do well, but brick-and-mortar retailers that had online purchase options, in-store pickup, or curbside options, also outperformed.
The top dollar growth subsegments in 2020 were sports toys, which includes roller skates, skateboards, and scooters (+31%); fashion dolls and accessories (+56%); building sets (+26%); games (+29%); and summer seasonal toys (+24%). The top properties of 2020 included L.O.L. Surprise!, Barbie, Star Wars, Pokémon, and Marvel Universe. The top five properties combined accounted for 13% of all toy sales for the year.
Movies in 2020 had a weaker impact on toy sales than they did in 2019, due to the lack of blockbuster movies compared to 2019, but also because of limited and postponed releases due to COVID-19. As a result, licensed toys underperformed during the year with a share of toys in 2020 of 28%, which is similar to the 28% share in 2017. Licensed toy sales did increase 15% in 2020, while non-licensed toys increased 17%. Licensed toys underperformed compared to the rest of the market; given the lack of blockbuster movies and the impact of the pandemic, that underperformance was not as bad as some might have expected.
After the most challenging year the world has seen in over a century, the toy industry has officially managed to not only maintain its momentum, but also to achieve a level of growth that we have never before seen. The industry’s resilience is very much underpinned by the reality that, in times of hardship, families look to toys to help keep their children engaged, active, and delighted. Put simply, toys are a big part of the happiness equation. While it will be difficult for the industry to match the unprecedented growth we saw in 2020, 2021 does have the potential to be another strong year for U.S. toy sales. With 65% of U.S. K-12 students learning at least partially remotely***, entertainment venues still shuttered, and a third round of stimulus checks anticipated to be approved by April, we can expect toy sales to continue to be elevated beyond normal sales levels in the near term.
*Source: The NPD Group/Retail Tracking Service, January-December 2020 vs. 2019
**Source: The NPD Group/Consumer Tracking Service/U.S./YTD September 2020 vs. 2019
***Source: Burbio/January 19, 2021
Data is representative of retailers that participate in The NPD Group’s Retail Tracking Service. NPD’s current estimate is that the Retail Tracking Service represents approximately 78 percent of the U.S. retail market for Toys.
This article was originally published in the February 2021 edition of the Toy Book. Click here to read the full issue!