


by Juli Lennett, vice president, industry advisor, U.S. toys, The NPD Group
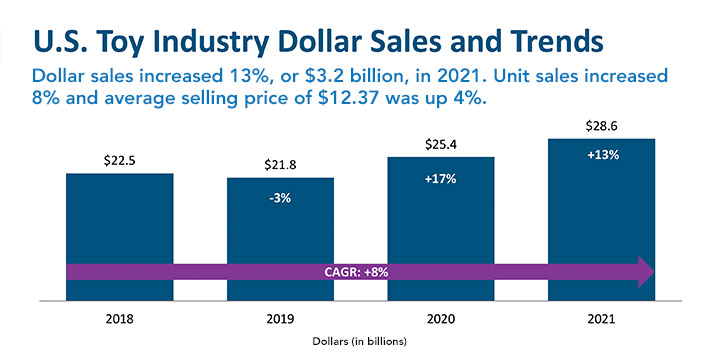
2021 was another banner year for the U.S. toy industry as dollar sales increased by 13%, or $3.2 billion, according to The NPD Group. Unit sales increased 8% and the average selling price of $12.37 was up 4% versus 2020.
Total industry sales, as tracked by NPD, reached $28.6 billion for the calendar year. When we look at the three-year compound annual growth rate (CAGR) from 2018-2021, toy industry dollar sales grew 8%, driven by an average selling price (ASP) growth of 8%. However, when we look at unit sales during that period, growth was a more modest 1%, which suggests that most of the growth over the last three years has come from increases in ASP.
When projected to 100% of the total market, the U.S. toy industry exceeded $38.2 billion, a new record.*
The COVID-19 pandemic continued to prop up the toy industry in 2021 in many ways. The most significant impact was the more than $500 billion that the government delivered to consumers via two stimulus payments, one of which hit weeks before Easter and catapulted first quarter 2021 dollar growth by 43%. The six child tax credit payments in the back half of 2021 also elevated growth in the weeks after it was delivered to families.
The ongoing pandemic lifestyle was also paramount to strong growth for the industry in 2021. The disposable income that consumers diverted from other forms of entertainment was a contributor, as they continued to look for ways to entertain their kids and themselves. More than half of the dollar gains in 2021 came from households with incomes greater than $100,000 — those households likely had more savings from not spending on vacations and other out-of-home entertainment. In addition, about 60% of the dollar gains came from “kidults” (ages 12 and up) who indulged in trading cards from franchises including Pokémon and Major League Baseball, building sets like LEGO, collectibles like Funko Pop! Vinyls, and other toys and games to fill their time at home.**
The COVID-19 pandemic has also driven the increase in ASP over the last two years. The increases we’re measuring have not simply been due to rising prices; the increases in ASP have also been a result of fewer promotions, less price sensitivity, and consumers trading up to higher-priced products, which may have been a self-fulfilling prophecy this holiday season as manufacturers shipped higher-margin products due to supply chain issues.

Annual Supercategory Performance
Looking at supercategory performance, 10 of the 11 supercategories NPD tracks experienced growth in 2021. Compared to 2019, all the supercategories posted a positive two-year CAGR. Outdoor and Sports Toys continued to be the largest supercategory with $5.9 billion in sales in 2021, while Explorative and Other Toys had the largest dollar gain of $557 million. It also had the fastest dollar growth versus 2020 of 35%. The only absolute dollar decline versus 2020 came from Youth Electronics, which declined 0.4%, or $2 million. Looking at CAGR compared to 2019, Explorative and Other Toys had the fastest growth of 24%, followed by Games and Puzzles at 23%.
Drivers of Change
Now let’s look at the brands and products that drove change across the 11 supercategories tracked by NPD:
Explorative and Other Toys had the largest dollar gain, which was driven by ZURU’s 5 Surprise and the NFL and NBA franchises.
ZURU’s Bunch O Balloons had the strongest growth in Outdoor and Sports Toys, with contributions also coming from MGA Entertainment’s Little Tikes and KidKraft’s Cedar Summit.
Games and Puzzles grew 14%, with Pokémon dominating the growth in the category, followed by What Do You Meme? and Hasbro’s Magic: The Gathering.
Action Figures growth of 24% was the third-fastest in the industry. The Jurassic World brand had the largest growth, followed by Funko Pop! and Moose Toys’ Heroes of Goo Jit Zu.
Plush had the second-fastest growth of all supercategories, up 30%. Squishmallows from Jazwares topped the growth, followed by the CoComelon brand and Magic Mixies from Moose Toys.
Building Sets were up 16%, outperforming market growth. LEGO Star Wars sets had the largest gains in this category, and contributions also came from LEGO Creator Expert and LEGO Super Mario.
Infant, Toddler, and Preschool Toys underperformed the industry’s growth, but had the biggest gains with CoComelon, Bluey, and
PAW Patrol toys.
Dolls grew 4% with MGA Entertainment’s Rainbow High property as the top growth property in the category, followed by Mattel’s Barbie and the Disney Princess brand.
Vehicles grew 9% with Mattel’s Hot Wheels contributing most of the growth. Products from Nintendo and Sharper Image were the No. 2 and No. 3 growth drivers.
Arts and Crafts grew 2%, with Spin Master’s Kinetic Sand, LEGO Art, and Hasbro’s Play-Doh as the major contributors for growth.
Finally, Youth Electronics had the only decline of $2 million, primarily driven by declines in Disney Frozen products. Bandai’s Tamagotchi and Moose Toys’ Little Live Pets were the two largest-gaining properties.
Looking Ahead to 2022
With inflation in December 2021 at 7% — the fastest pace since 1982 — and price increases for toys in stores on the horizon, consumers’ reactions to these price increases will likely be the biggest story in 2022. With this, understanding price elasticity will emerge as the most important initiative for manufacturers and retailers to maximize sales in 2022.
In addition, with 32% dollar growth over the last two years of the pandemic (2021 versus 2019) and fewer toys likely to be purchased in 2022, success in the market will be measured in market share gains and losses.
On the plus side, if the pandemic has taught us anything, it has reinforced the belief we already had: Parents will put their kids’ health and happiness above all else, and toys are one of the best bets to make that happen at home.
- Source: The NPD Group/U.S. Toys Retail Tracking Service, January-December 2021
- *Source: The NPD Group/U.S. Toys Checkout Tracking, January-December 2021
- **Source: The NPD Group/U.S. Toys Checkout Recipient Insights, January- December 2021
This article was originally published in the February 2022 edition of the Toy Book. Click here to read the full issue!